The Duck Curve Is Here: What MTerra’s Arrival Means for Every Other Solar Developer in Luzon
By Patrick Tan ·
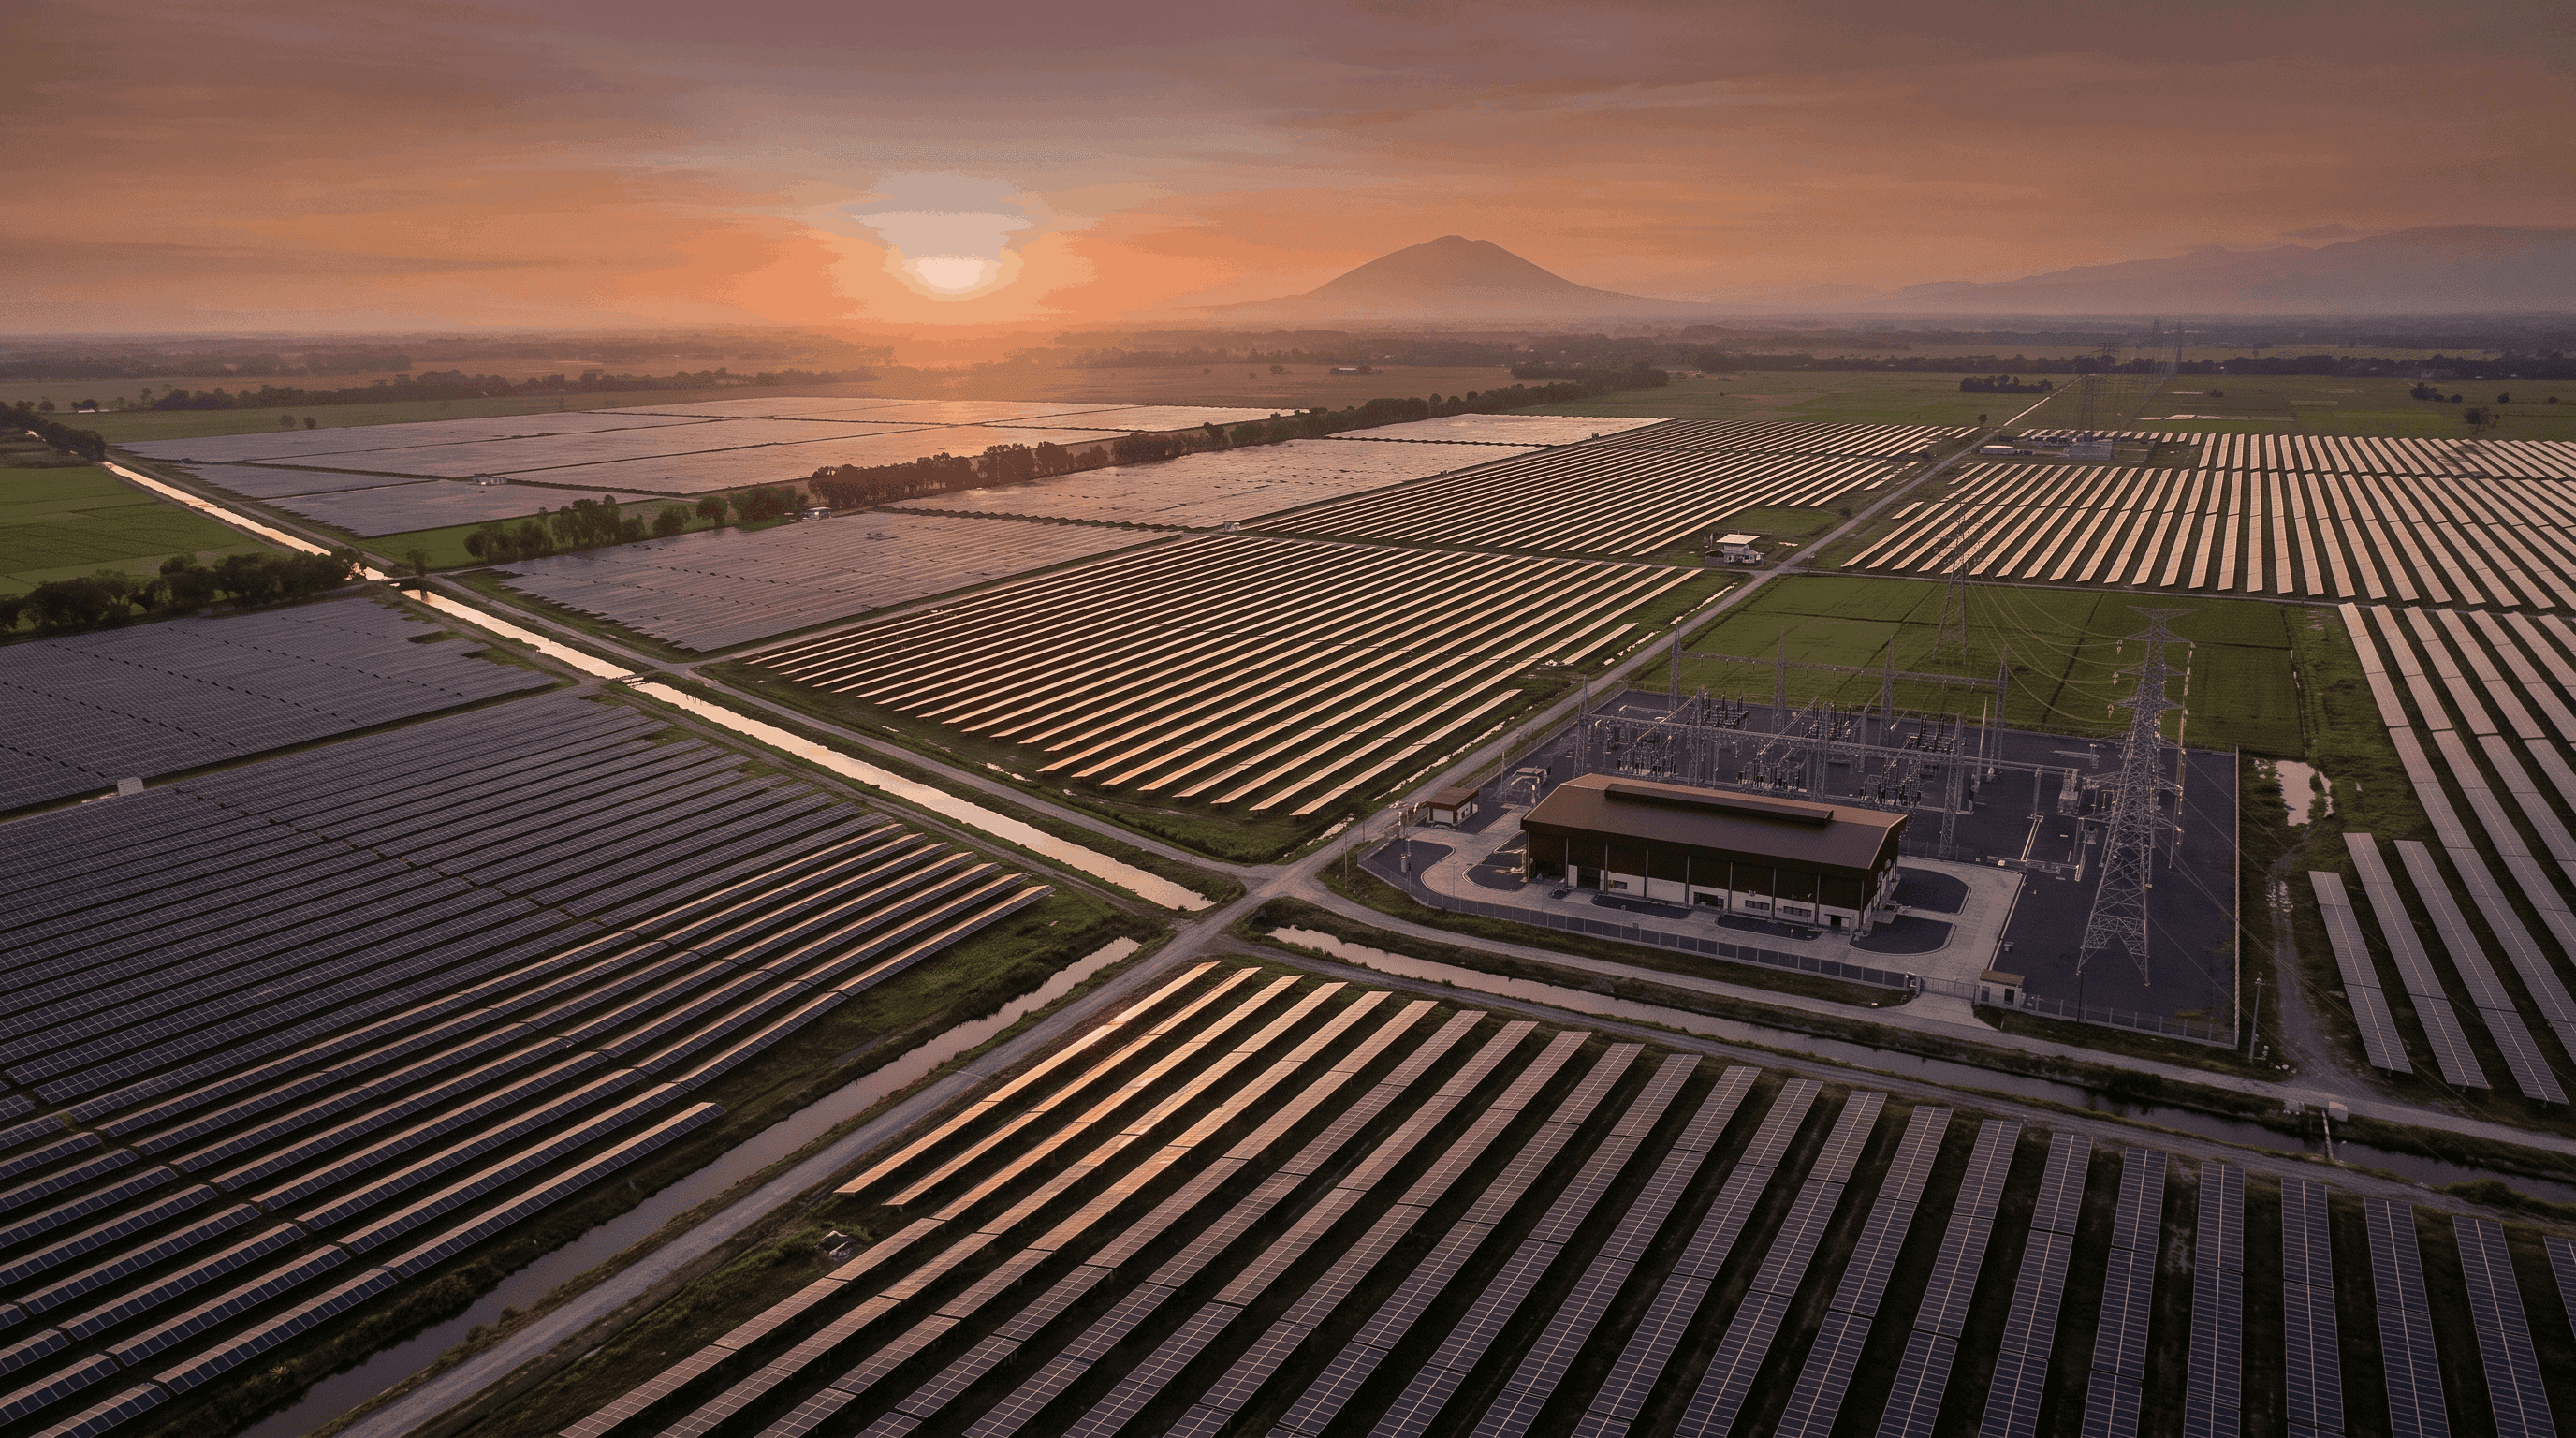
On 14 March 2026, Meralco PowerGen Corporation announced that MTerra Solar had delivered its first electrons to the Luzon grid. Sixteen months from groundbreaking to generation — a remarkable feat of execution by any measure. Government officials celebrated. Sponsors took a well-earned bow. Energy Secretary Sharon Garin noted that the project, once fully completed, could supply around 10% of Luzon’s power needs.
It is a genuine milestone. But for developers, investors, and lenders with projects in the Luzon pipeline, MTerra’s arrival signals something more than a record broken. It is a forcing function—the moment a risk that has long been discussed in project finance rooms and market outlooks becomes impossible to defer. That risk is solar cannibalisation: the self-defeating dynamic in which the growth of solar generation suppresses the very market prices that solar projects depend on to generate returns.
MTerra did not create this problem. The Luzon solar pipeline was always going to get here eventually. What MTerra does is accelerate the timeline, concentrate the effect, and make the question urgent for every developer sizing a project today. The cannibalisation paradox is no longer a future scenario. It is the current market condition.
What MTerra Actually Is
To understand the market implications, it helps to first appreciate the scale of what has just been connected to the grid.
MTerra Solar is a joint venture between Meralco PowerGen Corporation (MGEN), sustainable infrastructure investor Actis, and Solar Philippines New Energy Corporation (SPNEC), developed through their subsidiary Terra Solar Philippines Inc. The project is being built in two phases across more than 3,500 hectares in Nueva Ecija and Bulacan—both in Luzon, approximately 100 kilometres north of Manila.
At full completion, MTerra will comprise 3,500 megawatts-peak (MWp) of solar photovoltaic capacity paired with 4,500 megawatt-hours (MWh) of battery energy storage—making it the world’s largest integrated solar-plus-storage facility. Total investment exceeds USD 4 billion. Phase 2 construction has already commenced.
Phase 1 is what matters for the market right now. As of end-January 2026, Phase 1 had 1,288 MWdc of installed solar capacity—already the largest solar installation in the Philippines. By February 2026, the project achieved initial grid synchronisation. By March 2026, it was delivering power as a generator, with an initial export of 85 MW of firm capacity to the grid under a Power Supply Agreement (PSA) with Meralco, the country’s largest distribution utility.
That PSA is the critical commercial detail. MTerra’s revenues are anchored to a long-term contracted offtake arrangement with a creditworthy counterparty. That structure is what made the project financeable at this scale. It is also, as we will return to, what insulates MTerra from the very market dynamic it is accelerating.
The Market Was Already Moving
The Luzon Wholesale Electricity Spot Market (WESM) was already shifting before MTerra delivered its first electron. In 2025 alone, the Philippines added roughly 1 GW of new renewable capacity—the bulk of it solar, the bulk of it in Luzon—and the intraday price curve was already showing the strain. Midday prices were compressing toward zero as solar flooded the grid; evening prices were spiking as output faded and conventional generators scrambled to ramp up. The solar duck curve, familiar from California and Australia, was taking shape in Luzon.
MTerra’s ramp-up has deepened it—but the structural driver is the pipeline, not any single project. The Green Energy Auction Programme (GEAP) has awarded substantial capacity across multiple rounds; GEA-4 alone awarded over 10 GW of solar capacity. Even without MTerra, the cumulative Luzon build-out was always going to produce this dynamic.
Three Questions Every Developer Must Now Answer
For a developer underwriting a new 200–500 MW solar project in Luzon today, cannibalisation translates into three specific, quantifiable questions. They are not rhetorical. Lenders and investment committees will increasingly require credible answers to each of them before a project can reach financial close.
When does the duck curve fully emerge?
The duck curve is already visible in intraday WESM data. But there is a meaningful difference between episodic midday price softness—which can be managed—and structural, persistent midday price suppression that redefines the revenue profile of a solar project across its entire operating life. At what cumulative installed solar capacity on Luzon does the latter condition become entrenched? The answer depends on demand growth, the pace of new solar additions, interconnection constraints, and storage deployment. It is not a single number—it is a range of scenarios, each with a different implication for project economics.
How deep does the trough go?
The depth of the midday price trough is the primary driver of revenue impairment for solar projects with merchant or partially merchant revenue exposure. A trough that averages PHP 2/kWh is a very different underwriting environment than one that averages PHP 0.50/kWh—or touches zero for extended periods. The floor is not zero in perpetuity; demand growth and retirements of older thermal capacity will put a natural limit on how far prices fall. But the trajectory matters enormously for the revenue assumptions embedded in a financial model built today for a project that will be operating in 2028, 2030, or 2035.
How does the evening ramp evolve?
The evening price spike is the flip side of the duck curve and a significant revenue opportunity for projects with storage. But as BESS deployment grows, storage arbitrage gradually erodes that spread. Understanding the pace of that erosion—and what evening prices look like under different storage penetration scenarios—is critical for sizing co-located storage and stress-testing hybrid project economics.
None of these questions can be answered reliably using historical averages or simple extrapolations. They require scenario-based, long-term fundamental power price forecasting—modelling solar build trajectories, storage penetration, transmission constraints, and demand growth simultaneously across a debt-tenor timeframe.
This is precisely the gap that Aurora Energy Research’s Philippines power market and grid forecasting addresses. As the first provider of bankable long-term nodal price forecasts for the Philippines market, Aurora’s scenario modelling is built to answer exactly these questions with the analytical rigour that lenders and investment committees require—not as a single-point prediction, but as a structured range of outcomes that allows developers and their financiers to stress-test revenue assumptions against realistic market trajectories.
Contracted Doesn’t Always Mean Protected
A natural developer response to the cannibalisation concern is: I have a contract, so I’m insulated from spot market movements. This instinct is understandable, but in the Philippines’ nodal market design, it is only partially correct—and the gap between “contracted” and “protected” is widening. A contracted offtake agreement does not automatically insulate a developer from cannibalisation. MTerra’s Meralco PSA does—but that structure is not available to most developers today.
For developers under Power Supply Agreements with distribution utilities (DUs) or under contracts with Retail Electricity Suppliers (RES)—the two most common contracted structures outside of the government auction programme—there is a risk that is easy to overlook at financial close: line rental costs.
Line rental in the Philippine nodal market is the cost arising from the price difference between the node where a generator connects to the grid (the generation node) and the node where its contracted customer takes delivery (the customer node). In the Philippines’ nodal market design, this difference is real, it can be material, and—critically—it is borne by the generator under most PSA and RES contract structures.
As solar cannibalisation deepens prices at generation nodes—particularly in solar-dense corridors in Central and Northern Luzon where large projects tend to cluster—the generation node price can fall faster and further than the customer node price. When that happens, the line rental cost widens, eroding the contracted revenue that the developer assumed was stable. The exposure is location-specific: a project well-positioned relative to its contracted customers may face modest basis risk, while a project in a congested solar corridor feeding a distant load centre could face materially higher line rental costs than were modelled at financial close.
The exception is the Renewable Energy Payment Agreement (REPA) under the Green Energy Auction Programme (GEAP), where nodal price risk is absorbed by TransCo as the offtaker. Developers assessing offtake options today should understand where nodal basis risk sits in each structure—it is as important as the headline tariff.
The Duck Curve as Investment Case
Here is the reframe: the same price signal that compresses solar merchant revenues is the investment case for battery storage. A deeper midday trough widens the arbitrage spread between cheap midday solar and the high-priced evening ramp—that spread is what drives BESS returns.
MTerra’s 4.5 GWh BESS illustrates the logic at scale: shift generation out of the trough, capture the evening ramp, partially hedge cannibalisation exposure. Co-located BESS changes a solar project’s revenue profile fundamentally. As the Department of Energy Philippines makes co-located storage mandatory for new renewable projects, the policy framework is catching up to what the market economics already signal.
The duck curve is already here and deepening. The question for every developer and investor in the Luzon market is not whether it will affect your portfolio—it is whether your revenue assumptions reflect that reality, and whether you are positioned to be hurt by it or to profit from it. In a market moving this fast, the quality of your forecasting is no longer a modelling preference. It is a competitive advantage.
Aurora Energy Research is a long-term power market and grid forecaster, where we provide long-term nodal price forecasts and standard battery investment cases for Philippines market participants.
Also published on other platforms
Aurora Energy Research under Aurora Insights: https://auroraer.com/resources/aurora-insights/articles/the-duck-curve-is-here-what-mterras-arrival-means-for-every-other-solar-developer-in-luzon
Related insights
- Record-Breaking High Prices for the Visayas and Their Implications for Developers
· Wholesale power market design, Regulation, Storage economics
- Mandated, Not Monetised: Making Co-Located Storage Profitable in the Philippines
· Storage economics, Ancillary services, Transmission grid curtailment
- GEA4: Supporting Clean Energy or Subsidising Poor Siting Decisions?
· Renewables economics, Transmission grid curtailment, Regulation